Correspondence:[*]Ningbo Optoelectronics Co Ltd Image pision; Supcoinformation building, 352 Binkang Road, Binjiang District, Hangzhou;chengyu05@gmail.com
Abstract: With the popularity of depth cameras, the processing of point clouds is becoming more and more important.The noise and spatial geometric information of point cloud is one of the difficulties in feature extraction. In this paper, inspired by transformer [1] and pointweb [2], we propose a novel end-to-end network structure called pointCSA. According to the feature extraction of different layers, different point cloud downsampling methods are used. For the first layer, we use the self-attention to sample in groups. For the second layer, we use the self-attention for sampling, which helps to eliminate outliers, but also helps to improve feature extraction. It is more beneficial to sample the outline of the object when there are few points. In order to further extract the location features, we connect each point densely in a local neighborhood, and then specify the feature of each point based on the corresponding local region feature. Regional feature extraction only extracts partial features of all points, and considering on this basis we add the extraction of overall features. Partial features and global features are concatenated. Experiments have verified that we have achieved good results in sampling and classification and segmentation.
Keywords: point cloud,classification,segmentation,point cloud downsampling, outliers.
We live in a 3D world. With the research of 3D sensors, 3D convolutional neural networks have begun to develop rapidly. 3D information has a wide range of applications in autonomous driving [3][4][5][6] and computer vision [7][8]. There are many ways to express 3D data, such as parametric surface, binary volumetric grids, point cloud, polygonal mesh etc. Point cloud is the most common form of 3D data representation. while it is difficult to process point clouds. Firstly, The point cloud data is disordered and there are some outliers. Secondly, point cloud data is obtained from real-time, which is dynamically changing. In addition, the point cloud is also unstructured. Therefore, directly applying deep convolutional networks is not feasible.
Since standard convolutional operation can be directly applied to 2D images. Therefore, it is optional to convert 3D data into 2D data, such as voxel grids[9][10] or rendered views of the point clouds [11][12]. However, the amount of calculation and hardware storage consumption are relatively large. Therefore pointnet [13] and pointnet++ [14] are proposed. The pointnet++ [14] algorithm is pided into two parts, one part is sampling, and the other part is regional feature extraction.
In this paper,we have made improvements to sampling and regional feature extraction. We propose an end-to-end network called pointCSA.The network contains one global feature extraction network and one local feature extraction network based on combined sampling. This paper is mainly pided into two parts: efficient sampling of point cloud; and extraction of point cloud regions and their features.
Usually the point cloud data must be preprocessed. One common method is sampling. Farthest point sampling (FPS) [14] is currently the most commonly used method. This method comes from pointnet++ [14] and is used to extract regional features. The farthest point sampling [14] is based on distance, it is easy to introduce noise and outlier points. PDS[15] is a pre-defined method for sampling, and it is not data-driven. GSS [16] samples the points with learned weights. AS (Adaptive Sampling) [17], it not only considers the position information, but also considers the weight of the point. However, it updates the sampling point by point, and the sampling efficiency is low.
In terms of feature extraction, pointnet++ [14] extracts local areas, but ignores the positional relationship between points. DGCNN [18] considers the positional relationship of points, but does not consider the positional relationship of points sufficiently, and ignores regional features. Pointweb [2] fully considers the location characteristics of regional points, but does not consider the overall point location relationship in the down-sampling process.
In order to overcome the problems mentioned above, we propose a different data sampling module. This sampling module is data-driven. The CSA model can improve the robustness of the model. Inspired by the pointweb[2] network, we connect all the points to extract the regional location information. To enhance the overall information, we add the overall feature extraction when extracting regional features.
Our main contributions are as follows:
We combine different data-driven sampling based on the self-attention module.
We improve the regional feature extraction in pointweb [2] by adding global feature extraction.
2. Related Work
For 2D images, the pixel arrangement is regular and orderly, but the opposite is true for 3D data. The disorder and irregularity of 3D data make it hard to directly use CNN for convolution processing. There are several general ways for processing 3D data. One of them is to grid the data and make it regular. Or to change the CNN convolution method to make it suitable for 3D data, Or applying it directly on the point cloud.
Volumetric-based Methods: This is a form of voxel grid that transforms 3D data into regular. However, this method will increase the computer's memory and calculations exponentially with the increase of voxel grids, which seriously affects the calculation speed. There are also some works that are doing memory and calculation optimization. Since the 3D data is distributed relatively-discrete in space, the features of the voxel grid are also various. Utilizing the same extracting method will make feature extraction insufficient. For example, OctNet [19] used an unbalanced Octree with hierarchical partition.Wang et al. [20] proposed an Octree-based CNN for 3D shape classification.The running time is shorter and the memory required is less.
Convolution-based Methods: Many methods directly change the convolution method and then apply it to the point cloud.For example, SpiderCNN [21] defines the kernel weights as a family of polynomial functions. Spherical CNN [22] designs spherical convolution to solve the point cloud rotation problem. PointCNN [23] customized X-Conv operation to process point clouds. PointConv [24] and KPConv [25] constructed convolution weights based on input coordinates. InterpCNN [26] used coordinates to insert point-by-point kernel weights. PCCN[27] expressed the convolution kernel as MLP.
Graph-based Methods: Capturing the shape and geometry of the underlying 3D point cloud, [28] represented the point cloud as a set of interconnected shapes and superpoints, which are connected by simple lines by using directed graphs to obtain graph structure and contextual information. To better capture local geometric relationships in high-dimensional spaces, Kang et al. [29] proposed a Graph Embedding Module (GEM) based PyramNet and Pyramid Attention Network (PAN).
Point-based Methods: Pointnet [13] was a pioneer in directly dealing with point clouds. The symmetric function was used to achieve the permutation invariance of the point cloud. Pointnet [13] used MLP independent learning point features, and used a max-pooling layer to extract global features. To overcome the lack of local structural feature extraction, Qi et al. [14] proposed pointnet++ [14]. Benefiting on the simple structure and strong representation of pointnet [13], many networks were proposed. For example, the Point Attention Transformers (PATs) [30] network learned the relative and absolute location characteristics of points in the area through MLP. The points with larger feature weights were extracted through the transformer. Pointweb [2] mainly used the context of the neighborhood to extract features. [31] proposed a Structural Relational Network (SRN) to learn structure-related features by using MLP. The pointASNL [32] network first optimized sampling, and then extracted regional features and related features outside the overall region.
3.Our method
Our network is pided into two parts: the sampling and the feature extraction. Feature extraction contains one local feature extraction and one global feature extraction.
3.1 Hybrid sampling
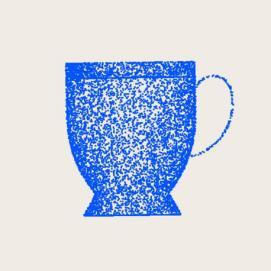
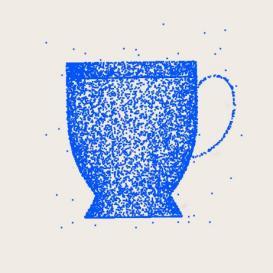
There are many sampling methods, and the most commonly used sampling method is farthest point sampling. But it is based on distance and is more sensitive to outliers and noise. Based on pointASNL[32] proposing an adaptive sampling method,As shown in Figure 1, which is a data-driven sampling method that can remove outliers and noise. But adaptive sampling is to update each point in a group. When the down-sampling reaches a certain level, there will be many points that will be denser.
In order to overcome the above problems. We propose a Hybrid sampling algorithm. First, the original data is sampled at the farthest point, and ![]() points are collected.let
points are collected.let ![]() as the sampled
as the sampled ![]() points from row-data input points of first layer,
points from row-data input points of first layer,![]() from
from ![]() and
and ![]() from
from ![]() as a sampled point and its features.We first search neighbors of sampled points as groups via k-NN[33] query, then use general self-attention mechanism. update each point.The two sampling methods are shown in Figure 1 and Figure 2.
as a sampled point and its features.We first search neighbors of sampled points as groups via k-NN[33] query, then use general self-attention mechanism. update each point.The two sampling methods are shown in Figure 1 and Figure 2.
The network enters the initial point cloud and updates the first point.We use all the points in the group to update the group feature.For![]() and their corresponding features
and their corresponding features![]() , where
, where![]() is
is ![]() nearest neighbors of sampled point
nearest neighbors of sampled point ![]() , feature updating of group member
, feature updating of group member![]() can be written as
can be written as
![]() (1)
(1)
Where R represents the correlation between each point in the group and other points in the high-dimensional space,Where ![]() .The
.The ![]() function represents the feature of the high-dimensional space group.Function A is an integrated function.r function is
function represents the feature of the high-dimensional space group.Function A is an integrated function.r function is ![]() ,R is the dot product of the point relationship. Similar to the QK of the self-attention mechanism, the formula is as follows:
,R is the dot product of the point relationship. Similar to the QK of the self-attention mechanism, the formula is as follows:
(2)![]()
![]() and
and ![]() is a linear transformation realized by one-dimensional convolution.
is a linear transformation realized by one-dimensional convolution.
After that, Then convolution operation is performed on the points, and then through softmax, the weights of the points in the group and the feature weights of the points in the group are respectively obtained.The specific operations are as follows:
![]()
![]() (3)
(3)
![]()
![]()
Then we obtain a new coordinate of sampled point ![]() and its features
and its features ![]() by following operation:
by following operation:
![]()
![]() (4)
(4)
![]()
![]()
Through the last sampling, we get the features of each point.![]() and the features of each point
and the features of each point![]() ,All the points above make a self-attention in a group.The redistribution weight formula is as follows:
,All the points above make a self-attention in a group.The redistribution weight formula is as follows:
![]()
![]() (5)
(5)
The feature dimension is reduced to one dimension through MLPs.Create a learnable score,![]() .Assign
.Assign![]() and features into pairs
and features into pairs ![]() .We define the correlation between s and features, sort according to the score of
.We define the correlation between s and features, sort according to the score of
![]() , and then select the top K < N as sampling points. After that, do softmax activation for each point feature, which can be represented as normalized weights for each coordinate axis and features channel.
, and then select the top K < N as sampling points. After that, do softmax activation for each point feature, which can be represented as normalized weights for each coordinate axis and features channel.
![]() (6)
(6)
![]()
Figure 1. adaptive sampling. Figure 2. top-M sampling.
3.2 Regional feature extraction
First select a local region R.The feature of each point in the area is represented by ![]() .The feature is enhanced by the relationship between each point and all points in the local area.The feature extraction process is shown in Figure 3.The feature of each point can be expressed as follows:
.The feature is enhanced by the relationship between each point and all points in the local area.The feature extraction process is shown in Figure 3.The feature of each point can be expressed as follows:
![]() and
and ![]() (7)
(7)
Where ![]() is the enhanced
is the enhanced ![]() , and
, and ![]() is the positional relationship between
is the positional relationship between ![]() and other points.The formula is expressed as:
and other points.The formula is expressed as:![]()
![]() (8)
(8)
Among them, ![]() is the influence between two points, and
is the influence between two points, and ![]() is the correlation between the two points.We use a multilayer perceptron to fit the influence between two points.The formula is as follows:
is the correlation between the two points.We use a multilayer perceptron to fit the influence between two points.The formula is as follows:
![]() (9)
(9)
Here g uses subtraction.That is ![]() .Here if
.Here if ![]() .
.
Here the correlation function ![]() can be expressed as follows:
can be expressed as follows:
![]() (10)
(10)
Now, for each feature ![]() in local region R, the overall output of the feature adjustment is:
in local region R, the overall output of the feature adjustment is:
![]() (11)
(11)
Where
![]() (12)
(12)
We obtain the mutual influence factors between point channels in the whole region. The formula is expressed as:
![]() (13)
(13)
The channel is denoted by C, the interaction map is denoted by ![]() , and the features of each point are integrated as follows:
, and the features of each point are integrated as follows:
![]() (14)
(14)
Where:
 (15)
(15)
Figure 3. Regional feature extraction.
3.3 Global feature extraction
According to the inspiration of the transformer, we pay attention to the global points, and then select the points with larger weights for feature extraction. In the first layer, We can get the coordinates and corresponding features of all points.The dimension of all points is reduced to 1 dimension by MLP, that is, the relative score. By score we select the top-M point features. M and local area points are the same.Take them as the overall features of all point clouds.After the second adoption, we directly pick the features of the top-M points from the top-K features.The process is shown in Figure 4.
Figure 4. global feature extraction.
3.4 Network Architecture
We construct a network architecture that fuses global features and local features.Picture 5 is the structure of the whole network..
Note:AS(adaptive sampling),RFE(Regional feature extraction), GFE(Global feature extraction),TOP-M(Weighted highest point sampling)
Figure 5.The overall structure of the network
Experiment
We evaluate our network on a wide variety of datasets.To demonstrate the efficiency of our network, we conduct experiments on classification tasks and segmentation tasks, respectively.We implement the model using pytorch [34] on two gtx 2080ti GPUs.
Implementation details
Our experiments are based on the pytorch [34] framework and use the sgd [35] optimizer. The learning rate is 0.05. The size of bitch is 16. We train it for 100 epochs and decay the learning rate by 0.1 for every 25 epochs. For the classification network, we first take fps for sampling, and then update each point by region attention with 1024 input points. Second and third samplings utilize global attention, and top-k is selected. The number of second sampling points is 512, and the third is 128.
Classification
On the classification task, we evaluate our model on modelnet10 and modelnet40 [36]. Modelnet40 [36] consists of 9843 training objects and 2468 testing object. Modelnet10 has 3991 training objects and 908 testing objects. Modelnet10 is part of modelnet40 [36], modelnet40 [36] has 40 categories and modelnet10 has 10 categories.
Our training data and test data are similar to pointnet [13]. First we sample 1024 points as input to the network.We employ several ways for data augmentation. The details are as follows: randomly translate the range [-0.1, 0.1], and randomly dropout 20% of the point cloud data. Randomly scale points in the range [-0.8,1.25]. The way our network down samples points is 1024-512-128. In this experiment, we also did a down sampling of 256-128-64 point that.have achieved the best results.
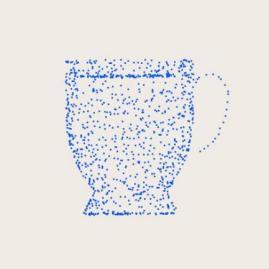
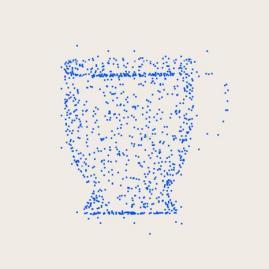
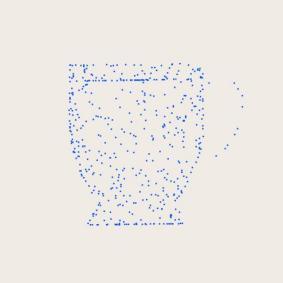
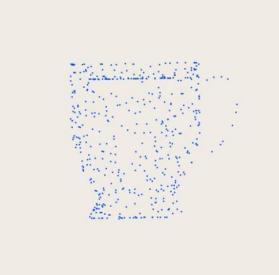
To verify the robustness of our model, we test the performance of our model by removing some points in the point cloud, and then adding some uniform noise directly within [-1, 1] at random. We add varying amounts of noise and then test on different networks. The comparison results are shown in the table 1.We also visualize the sampled point cloud as shown.Figure 6 is the original data and added noise data, Figure 7 is the FPS sampling of the original data and noise data, and Figure 8 is the adaptive sampling and TOP-M sampling.
Table 1. Shape classification results on ModelNet40 dataset
Method | input | #points | M10 | M40 |
Kd-Net[37] | pnt | 32k | 94.0 | 91.8 |
PointNet++[14] | pnt, nor | 5k | - | 91.9 |
SpiderCNN[21] | pnt, nor | 5k | - | 92.4 |
KPConv[25] | pnt | 7k | - | 92.9 |
DGCNN[18] | pnt | 1k | - | 92.2 |
PointCNN[23] | pnt | 1k | - | 92.2 |
PCNN[38] | pnt | 1k | 94.9 | 92.3 |
PointConv[24] | pnt, nor | 1k | - | 92.5 |
PAT[30] | pnt, nor | 1k | - | 91.7 |
A-CNN[39] | pnt, nor | 1k | 95.5 | 92.6 |
PointASNL[32] | pnt, nor | 1k | 95.5 | 92.9 |
PointCSA(ours) | pnt, nor | 1k | 95.7 | 93.2 |
(b) (c) (d)
Figure 6.(a)Original image and (b)added noise Figure 7. (c,d)FPS sampling
(e) (f)
Figure 8.(e)Adaptive Sampling Figure 9. (f)TOP-M Sampling
4.3. Segmentation
The S3DIS [40] dataset contains 3D scans in six areas including 271 rooms. Each point in the scan is annotated with one of the semantic labels from 13 categories (chair, table, ceiling, floor, clutter etc.). To prepare the training data, we follow [14], where the points are uniformly sampled into blocks of area size 1m×1m. Each point is represented with a 9D vector (XYZ, RGB and a normalized location in the room).
During the training, we randomly sample 4,096 points from each block on-the-fly. During the testing, we adopt all the points for evaluation. Following [14][41][42], we report the results on two settings, i.e., testing on Area 5 (rooms are not present in other folds) and 6-fold cross validation (calculating the metrics with results from different folds merged). For the evaluation metrics, we use mean of class-wise intersection over union (mIoU), mean of class-wise accuracy (mAcc), and overall point-wise accuracy (OA).
Performance comparison According to the two data settings mentioned above, our network achieves good performance. According to Tables 2 and 3, our network achieves the state-of-the-art with a performance of 88.5% on Area 5.The network also achieves a high level on the 6-fold cross evaluation.
Table 2. Semantic segmentation results on the S3DIS[40] dataset, evaluated on Area 5.
Method | OA | mAcc | mIoU | ceiling | floor | wall | beam | column | |
PointNet[13] | - | 49.0 | 41.1 | 88.8 | 97.3 | 69.8 | 0.1 | 3.9 | |
SegCloud[44] | - | 57.4 | 48.9 | 90.1 | 96.1 | 69.9 | 0.0 | 18.4 | |
PointCNN[23] | 85.9 | 63.9 | 57.3 | 92.3 | 98.2 | 79.4 | 0.0 | 17.6 | |
SPGraph[45] | 86.4 | 66.5 | 58.0 | 89.4 | 96.9 | 78.1 | 0.0 | 42.8 | |
PointWeb[2] | 87.0 | 66.6 | 60.3 | 92.0 | 98.5 | 79.4 | 0.0 | 21.1 | |
PAT[30] | - | 70.8 | 60.1 | 93.0 | 98.5 | 72.3 | 1.0 | 41.5 | |
MinkowskiNet[46] | - | 71.7 | 65.4 | 91.8 | 98.7 | 86.2 | 0.0 | 34.1 | |
KPConv[25] | - | 72.8 | 67.1 | 92.8 | 97.3 | 82.4 | 0.0 | 23.9 | |
PointCSA | 88.5 | 73.6 | 69.7 | 92.9 | 98.1 | 88.4 | 0.0 | 38.5 | |
window | door | table | chair | sofa | bookcase | board | clutter | | |
46.3 | 10.8 | 59.0 | 52.6 | 5.9 | 40.3 | 26.4 | 33.2 | | |
38.4 | 23.1 | 70.4 | 75.9 | 40.9 | 58.4 | 13.0 | 41.6 | | |
22.8 | 62.1 | 74.4 | 80.6 | 31.7 | 66.7 | 62.1 | 56.7 | | |
48.9 | 61.6 | 84.7 | 75.4 | 69.8 | 52.6 | 2.1 | 52.2 | | |
59.7 | 34.8 | 76.3 | 88.3 | 46.9 | 69.3 | 64.9 | 52.5 | | |
85.1 | 38.2 | 57.7 | 83.6 | 48.1 | 67.0 | 61.3 | 33.6 | | |
48.9 | 62.4 | 81.6 | 89.8 | 47.2 | 74.9 | 74.4 | 58.6 | | |
58.0 | 69.0 | 81.5 | 91.0 | 75.4 | 75.3 | 66.7 | 58.9 | | |
60.5 | 68.2 | 85.6 | 90.5 | 78.6 | 78.6 | 77.5 | 60.6 | | |
Table 3. Semantic segmentation results on the S3DIS[40] dataset, evaluated with 6-fold cross-validation.
Method | OA | mAcc | mIoU |
PointNet[13] | 78.5 | 66.2 | 47.6 |
PointNet++[14] | - | 66.5 | 56.5 |
RSNet[47] | - | 66.5 | 56.5 |
PAT[30] | – | 76.5 | 64.3 |
SPGraph[45] | 85.5 | 73.0 | 62.1 |
PointCNN[23] | 88.1 | 75.6 | 65.4 |
ShellNet[48] | 87.1 | – | 66.8 |
PointWeb[2] | 87.3 | 76.2 | 66.7 |
KPConv[25] | – | 79.1 | 70.6 |
PointCSA | 88.3 | 80.5 | 72.6 |
Table 4. Ablation results on the S3DIS[40] dataset Area 5.
Method | OA | mAcc | mIoU |
FPS[14] | 86.22 | 66.19 | 60.3 |
GSS[30] | 86.32 | 67.55 | 61.28 |
AS[17] | 87.12 | 69.35 | 62.4 |
CS(ours) | 87.30 | 70.05 | 63.1 |
Table 5. Ablation results on the S3DIS[40] dataset Area 5.
Method | OA | mAcc | mIoU |
baseline | 86.97 | 66.64 | 60.28 |
Global feature | 87.1 | 69.4 | 63.8 |
CS+Global feature | 88.3 | 71.5 | 66.5 |
PointNet++[14] | – | - | 54.5 |
Global feature | 82.2 | 60.3 | 54.8 |
CS+Global feature | 83.4 | 61.5 | 55.1 |
Ablation Study First we sample in two ways, and then use self-attention for feature extraction. The sampling points are 1024-512-128.We also directly use FPS for sampling, the positional relationship between the points is subtracted and then use self-attention for feature extraction.
To evaluate the generality of the proposed module, we use pointweb[2] as the baseline for our comparisons. We use the baseline network for testing and then use different sampling methods for comparison. First we use the farthest point sampling, then use Gumbel Subset Sampling, use adaptive sampling, and then use the combined sampling proposed in this paper.The performance results are shown in Table 4.
In the second set of experiments, we also use pointweb [2] as the baseline, and then use the same sampling method to extract global features from the point cloud. The performance results are shown in Table 5.Then check out the segmentation performance on the s3dis [40] data.The performance is shown in Figure 10.
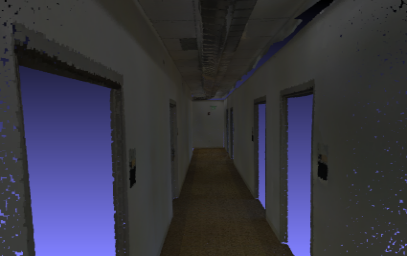
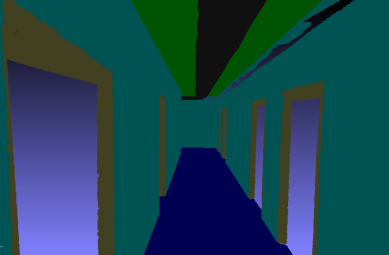
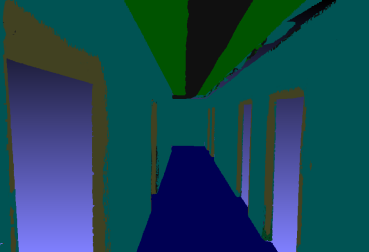
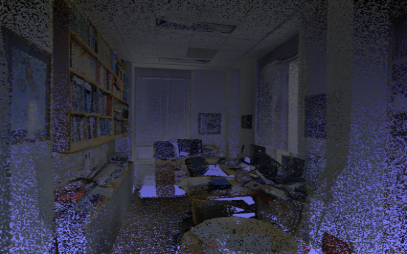
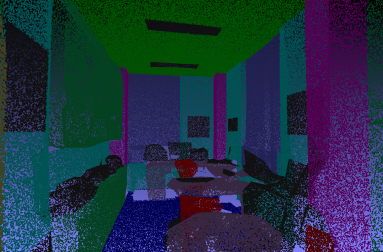
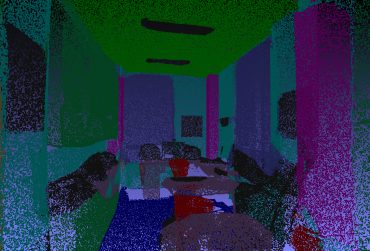
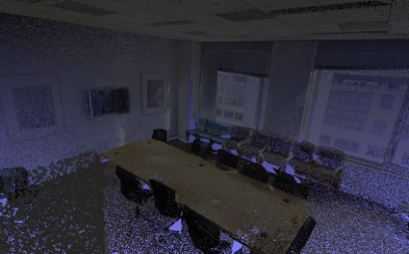
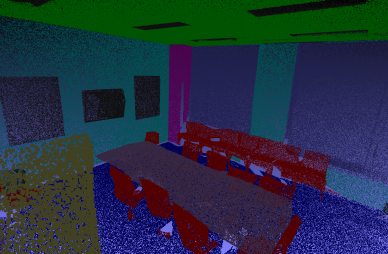
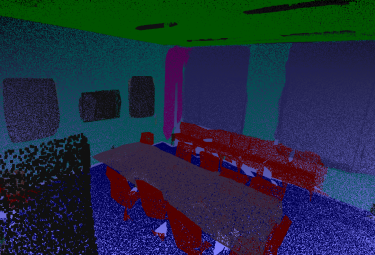
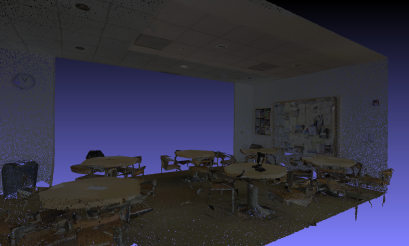
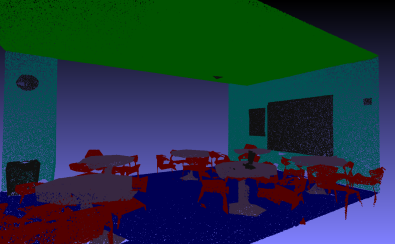
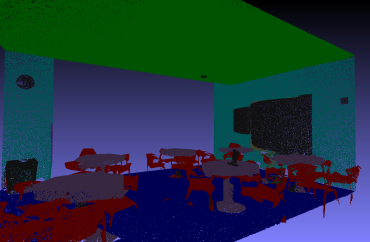
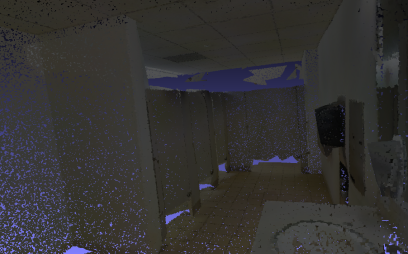
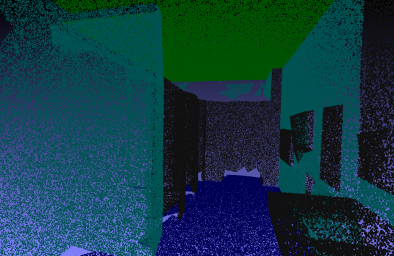
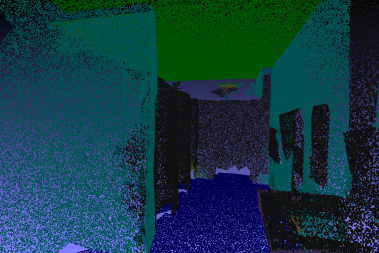
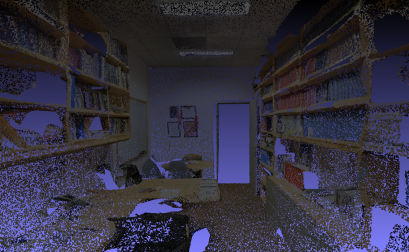
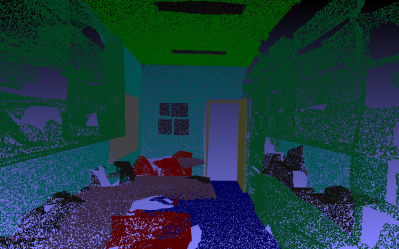
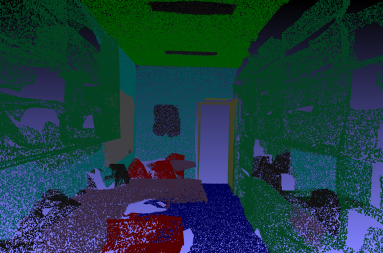
Input GT Prediction
Figure 10.Examples of indoor semantic segmentation on S3DIS[40] datasets.
Conclusion
Transformers have achieved great success in natural language and successfully applied them to 2D images. Inspired by this, we apply the transformer to point cloud sampling and feature extraction. Since the independence of point clouds is similar to natural language, it is more appropriate to apply transformers. The two sampling strategies we propose can fine-tune the spatial distribution of sampling points and greatly improve the robustness of the network. We use experiments to verify the rationality and effectiveness of the network structure.
In the following work, we will continue to verify the effectiveness of the transformer for point cloud classification and segmentation under the combined action of point cloud sampling and point cloud feature extraction.
Author Contributions: Jingle Li was responsible for the overall design of the study. Jingle Li performed the experiments and drafted the manuscript. Yu Cheng revised the manuscript. All authors read and agreed to the published version of the manuscript
Funding: This work is partially supported by Ningbo Optoelectronics Co Ltd Image pision.
Data Availability Statement: Publicly available datasets were analyzed in this study. This data can be found here:http://buildingparser.stanford.edu/dataset.html, https://shapenet.cs.stanford.edu/media/modelnet40_normal_resampled.zip
Conflicts of Interest: The authors declare no conflict of interest.
References
Parmar, Niki, et al. "Image transformer." International Conference on Machine Learning. PMLR, 2018.
Zhao, Hengshuang, et al. "Pointweb: Enhancing local neighborhood features for point cloud processing." Proceedings of the IEEE/CVF conference on computer vision and pattern recognition. 2019.
Alex H Lang, Sourabh Vora, Holger Caesar, Lubing Zhou, Jiong Yang, and Oscar Beijbom. Pointpillars: Fast encoders for object detection from point clouds. In Proceedings of the IEEE Conference on Computer Vision and Pattern Recognition, pages 12697–12705, 2019.
Nico Engel, Stefan Hoermann, Philipp Henzler, and Klaus Dietmayer.Deep object tracking on dynamic occupancy grid maps using rnns. In 2018 21st International Conference on Intelligent Transportation Systems(ITSC), pages 3852–3858. IEEE, 2018.
Nico Engel, Stefan Hoermann, Markus Horn, Vasileios Belagiannis, and Klaus Dietmayer. Deeplocalization: Landmark-based self-localization with deep neural networks. In 2019 IEEE Intelligent Transportation Systems Conference (ITSC), pages 926–933. IEEE, 2019.
Martin Simon, Kai Fischer, Stefan Milz, Christian Tobias Witt, and HorstMichael Gross. Stickypillars: Robust feature matching on point clouds using graph neural networks. arXiv preprint arXiv:2002.03983, 2020.
Charles Ruizhongtai Qi, Li Yi, Hao Su, and Leonidas J Guibas. Pointnet++: Deep hierarchical feature learning on point sets in a metric space.In Advances in neural information processing systems, pages 5099–5108,2017.
Charles R Qi, Or Litany, Kaiming He, and Leonidas J Guibas. Deep hough voting for 3d object detection in point clouds. In Proceedings of the IEEE
Daniel Maturana and Sebastian Scherer. Voxnet: A 3d convolutional neural network for real-time object recognition. In 2015 IEEE/RSJ International Conference on Intelligent Robots and Systems (IROS), pages 922–928.IEEE, 2015.
Zhirong Wu, Shuran Song, Aditya Khosla, Fisher Yu, Linguang Zhang, Xiaoou Tang, and Jianxiong Xiao. 3d shapenets: A deep representation for volumetric shapes. In Proceedings of the IEEE conference on computer vision and pattern recognition, pages 1912–1920, 2015.
Charles R Qi, Hao Su, Matthias Nießner, Angela Dai, Mengyuan Yan,and Leonidas J Guibas. Volumetric and multi-view cnns for object classification on 3d data. In Proceedings of the IEEE conference on computer vision and pattern recognition, pages 5648–5656, 2016.
Hang Su, Subhransu Maji, Evangelos Kalogerakis, and Erik LearnedMiller. Multi-view convolutional neural networks for 3d shape recognition. In Proceedings of the IEEE international conference on computer vision, pages 945–953, 2015.
Qi, Charles R., et al. "Pointnet: Deep learning on point sets for 3d classification and segmentation." Proceedings of the IEEE conference on computer vision and pattern recognition. 2017.
Qi, Charles Ruizhongtai, et al. "Pointnet++: Deep hierarchical feature learning on point sets in a metric space." Advances in neural information processing systems 30 (2017).
Pedro Hermosilla, Tobias Ritschel, Pere-Pau V´azquez, `Alvar Vinacua, and Timo Ropinski. Monte carlo convolution for learning on non-uniformly sampled point clouds. In SIGGRAPH Asia 2018
Jiancheng Yang, Qiang Zhang, Bingbing Ni, Linguo Li, Jinxian Liu, Mengdie Zhou, and Qi Tian. Modeling point clouds with selfattention and gumbel subset sampling. In Proceedings of the IEEE Conference on Computer Vision and Pattern Recognition, pages
Yan, Xu, et al. "Pointasnl: Robust point clouds processing using nonlocal neural networks with adaptive sampling." Proceedings of the IEEE/CVF Conference on Computer Vision and Pattern Recognition. 2020.
Phan, Anh Viet, et al. "Dgcnn: A convolutional neural network over large-scale labeled graphs." Neural Networks 108 (2018): 533-543.
G. Riegler, A. Osman Ulusoy, and A. Geiger, “OctNet: Learning deep 3D representations at high resolutions,” in CVPR, 2017.
P.-S. Wang, Y. Liu, Y.-X. Guo, C.-Y. Sun, and X. Tong, “O-CNN: Octree-based convolutional neural networks for 3D shape analysis,” ACM TOG, 2017.
Xu, Yifan, et al. "Spidercnn: Deep learning on point sets with parameterized convolutional filters." Proceedings of the European Conference on Computer Vision (ECCV). 2018.
Defferrard, Michaël, et al. "DeepSphere: a graph-based spherical CNN." arXiv preprint arXiv:2012.15000 (2020).
Li, Yangyan, et al. "Pointcnn: Convolution on x-transformed points." Advances in neural information processing systems31 (2018).
Wu, Wenxuan, Zhongang Qi, and Li Fuxin. "Pointconv: Deep convolutional networks on 3d point clouds." Proceedings of the IEEE/CVF Conference on Computer Vision and Pattern Recognition. 2019.
Thomas, Hugues, et al. "Kpconv: Flexible and deformable convolution for point clouds." Proceedings of the IEEE/CVF international conference on computer vision. 2019.
J. Mao, X. Wang, and H. Li, “Interpolated convolutional networks for 3D point cloud understanding,” in ICCV, 2019.
Zhang, Yong, et al. "PCCN: parallel cross convolutional neural network for abnormal network traffic flows detection in multi-class imbalanced network traffic flows." IEEE Access 7 (2019): 119904-119916.
L. Landrieu and M. Simonovsky, “Large-scale point cloud semantic segmentation with superpoint graphs,” in CVPR, 2018.
Z. Kang and N. Li, “PyramNet: Point cloud pyramid attention network and graph embedding module for classification and segmentation,” in ICONIP, 2019.
J. Yang, Q. Zhang, B. Ni, L. Li, J. Liu, M. Zhou, and Q. Tian, “Modeling point clouds with self-attention and gumbel subset sampling,” in CVPR, 2019.
Y. Duan, Y. Zheng, J. Lu, J. Zhou, and Q. Tian, “Structural relational reasoning of point clouds,” in CVPR, 2019.
Yan, Xu, et al. "Pointasnl: Robust point clouds processing using nonlocal neural networks with adaptive sampling." Proceedings of the IEEE/CVF Conference on Computer Vision and Pattern Recognition. 2020.
Zouhal, Lalla Meriem, and Thierry Denoeux. "An evidence-theoretic k-NN rule with parameter optimization." IEEE Transactions on Systems, Man, and Cybernetics, Part C (Applications and Reviews) 28.2 (1998): 263-271.
Paszke, Adam, et al. "Pytorch: An imperative style, high-performance deep learning library." Advances in neural information processing systems 32 (2019).
Cherry, J. Michael, et al. "SGD: Saccharomyces genome database." Nucleic acids research 26.1 (1998): 73-79.
Zhirong Wu, Shuran Song, Aditya Khosla, Fisher Yu, Linguang Zhang, Xiaoou Tang, and Jianxiong Xiao. 3d shapenets: A deep representation for volumetric shapes. In Proceedings of the IEEE conference on computer vision and pattern recognition, pages 1912–1920, 2015. 5, 6
Roman Klokov and Victor Lempitsky. Escape from cells: Deep kd-networks for the recognition of 3d point cloud models. In Proceedings of the IEEE International Conference on Computer Vision,pages 863–872, 2017. 6
Johnson, John L., and Mary Lou Padgett. "PCNN models and applications." IEEE transactions on neural networks 10.3 (1999): 480-498.
Komarichev, Artem, Zichun Zhong, and Jing Hua. "A-cnn: Annularly convolutional neural networks on point clouds." Proceedings of the IEEE/CVF Conference on Computer Vision and Pattern Recognition. 2019.
Iro Armeni, Ozan Sener, Amir R. Zamir, Helen Jiang, Ioannis Brilakis, Martin Fischer, and Silvio Savarese. 3D semantic parsing of large-scale indoor spaces. In CVPR, 2016.
Lyne P. Tchapmi, Christopher B. Choy, Iro Armeni, JunYoung Gwak, and Silvio Savarese. Segcloud: Semantic segmentation of 3d point clouds. In 3DV, 2017
Loic Landrieu and Martin Simonovsky. Large-scale pointcloud semantic segmentation with superpoint graphs. In CVPR, 2018.
Tchapmi, Lyne, et al. "Segcloud: Semantic segmentation of 3d point clouds." 2017 international conference on 3D vision (3DV). IEEE, 2017.
Loic Landrieu and Martin Simonovsky. Large-scale pointcloud semantic segmentation with superpoint graphs. In CVPR, 2018. 2, 5, 6
Hugues Thomas, Charles R Qi, Jean-Emmanuel Deschaud,Beatriz Marcotegui, Franc¸ois Goulette, and Leonidas JGuibas. Kpconv: Flexible and deformable convolution for point clouds. In ICCV, 2019. 1, 2, 5, 6, 7
Wang, Junjue, et al. "RSNet: The search for remote sensing deep neural networks in recognition tasks." IEEE Transactions on Geoscience and Remote Sensing 59.3 (2020): 2520-2534.
Wang, Junjue, et al. "RSNet: The search for remote sensing deep neural networks in recognition tasks." IEEE Transactions on Geoscience and Remote Sensing 59.3 (2020): 2520-2534.
Zhang, Zhiyuan, Binh-Son Hua, and Sai-Kit Yeung. "Shellnet: Efficient point cloud convolutional neural networks using concentric shells statistics." Proceedings of the IEEE/CVF international conference on computer vision. 2019.
作者信息:
李京乐,成宇,彭海霞,邓道举,杨莉
宁波微科光电股份有限公司杭州分公司 310056

客服QQ:30444492琼网文【2021】1550-113号
增值电信业务经营许可证:琼B2-20210322
出版物经营许可证:新出发龙华出字第(2021)009号
广播电视节目制作经营许可证:(琼)字第00779号
版权所有 ©2002-2024 期刊网(www.qikanchina.com) 琼ICP备2021005105号