1.南京农业大学作物表型组学交叉研究中心,江苏南京 210095; 2.法国农业和环境科学研究院 CAPTE实验室,阿维尼翁 210095,法国; 3.南京农业大学江苏省现代作物生产协同创新中心,江苏南京 210095; 4.南京农业大学国家信息农业工程技术中心 /教育部智慧农业工程研究中心,江苏南京 210095; 5.中国科学院植物研究所植被与环境变化国家重点实验室,北京 100093; 6.中国科学院大学,北京 100049
摘要: 冠层光截获能力是反映作物品种间差异的重要功能性状,高通量表型冠层光截获对提高作物改良效率具有重要意义。本研究以小麦为研究目标,利用数字化植物表型平台(D3P)模拟生成了100种冠层结构不同的小麦品种在5个生育期的三维冠层场景,记录了从原始冠层结构中提取的绿色叶面积指数(GAI)、平均倾角(AIA)和散射光截获率(FIPARdif)信息作为真实值,进一步利用上述三维小麦场景开展了虚拟的激光雷达(LiDAR)模拟实验,生成了对应的三维点云数据。基于模拟的点云数据提取了其高度分位数特征(H)和绿色分数特征(GF)。最后,利用人工神经网络(ANN)算法分别构建了从不同LiDAR点云特征(H、GF和H+GF)输入到FIPARdif、GAI和AIA的反演模型。结果表明,对于GAI、AIA和FIPARdif,预测精度从高到低对应的点云特征输入为GF+H > H > GF。由此可见,H特征对提高目标表型特性的估算精度起到了重要作用。输入GF + H特征,在中等测量噪音(10%)情况下,FIPARdif和GAI的估算均获得了满意精度,R2分别为0.95和0.98,而AIA的估算精度(R2=0.20)还有待进一步提升。本研究基于D3P模拟数据开展,算法的实际表现还有待通过田间数据进一步验证。尽管如此,本研究验证了D3P协助表型算法开发的能力,展示了高通量LiDAR数据在估算田间冠层光截获和冠层结构方面的较高潜力。
关键词: 冠层光截获;高通量表型;LiDAR;数字化植物表型平台(D3P);小麦冠层
中图分类号: TP391.4 文献标志码: A 文章编号: 202002-SA004
引文格式:刘守阳, 金时超, 郭庆华, 朱艳, Fred Baret. 基于数字化植物表型平台(D3P)的田间小麦冠层光截获算法开发[J]. 智慧农业(中英文), 2020, 2(1): 87-98.
Citation:Liu Shouyang, Jin Shichao, Guo Qinghua, Zhu Yan, Fred Baret. An algorithm for estimating field wheat canopy light interception based on Digital Plant Phenotyping Platform[J]. Smart Agriculture, 2020, 2(1): 87-98.
1 引言
由于人口增加和人类饮食结构的变化,全球粮食需求持续增加。同时,气候变化带来的作物生长环境的变化性和不确定性给培育适应未来
气候条件的高产作物品种带来了严峻挑战[1,2]。高通量作物表型监测被认为是应对这一挑战并提高作物改良效率的关键[3,4]。传统作物表型监测主要依靠人工田间调查、破坏性采样或专家经验评估,可获取的表型特性有限且效率低、误差大。相对而言,高通量表型监测可以高效地提供具有高遗传性状的表型特性,用于快速准确地评估不同品种之间的抗逆和高产特性,从而加速作物改良过程[5-7]。
冠层光截获是驱动作物生长发育的能量来源,直接影响作物的生物量累积和最终产量[8-10],是反应基因型间表型差异的重要功能性状[11-12]。冠层光截获能力一般用冠层截获的光合有效辐射的比率(Fraction of Intercepted Photosynthetically Activate Radiation,FIPAR)来表示。温室条件下,利用高通量室内表型平台,Cabrera-Bosquet等[13]开发了单株尺度的FIPAR高通量表型获取方法。田间条件下,鱼眼相机是测量冠层尺度FIPAR的常用方法[14]。但基于鱼眼相机的测量方法,容易受光照条件影响,在FIPAR较高时,测量误差较大。此外,利用鱼眼相机近地测量,各视角采样面积较小,需要多次重复和谨慎地采样来减少采样误差,导致该方法的通量较低[15]。因此,田间条件下对FIPAR的高通量表型监测仍有很大挑战。
激光雷达(Light Detection and Ranging,LiDAR)作为一种主动式遥感技术,通过发射激光脉冲实现对目标对象三维信息的无损测量。LiDAR对光线不敏感,能够昼夜工作,同时激光脉冲的强穿透能力能够获取垂直冠层的结构信息,受作物遮挡的影响小,这些特点允许LiDAR克服鱼眼相机等被动式监测技术的不足,且能更好地记录目标植株或冠层的三维信息。其中,地基LiDAR应用于作物表型领域已有较多探索。Liu等
[16]证明地基LiDAR可以提供比RGB图像更高的小麦绿色叶面积指数(Green Area Index,GAI)估算精度。Jimenez-Berni等[17]、Jin等[18,19]和Lin[20]发现地基LiDAR监测获取的点云数据可以提取作物株高、密度、生物量等性状。然而,基于地基LiDAR的田间FIPAR高通量表型监测还未见报道。
冠层光截获主要由结构特征GAI和平均倾角(Average Inclination Angle,AIA)及其概率分布决定[21]。为了简化冠层光传输的模拟,假设三维冠层结构为随机分布的均匀介质(即混沌介质)是遥感领域常用的方法。基于此假设,利用由LiDAR点云提取的多角度绿色分数(Green Fraction,GF)信息,通过反演一维冠层光传输模型,可以实现对GAI和AIA的估计[16,22],进而获得FIPAR。虽然这种方法基于光传输的物理机理,但是由于将冠层结构简化为一维,反演过程中并不能很好利用LiDAR获取的关于冠层高度剖面等较为详细的结构信息,在冠层较为郁闭(即GF接近于1)的情况下估算精度较低[16]。此外,还可以通过构建经验模型的方法实现从LiDAR点云特征到冠层结构及FIPAR的估算。相比而言,经验模型方法允许综合使用多种LiDAR点云特征,有潜力获得更高的估算精度,但该方法应用的难点和成功的关键在于准备大量有代表性的训练样本。得益于项目组前期工作开发的数字化植物表型平台(Digital Plant Phenotyping Platform,D3P)[23]可以生成不同品种小麦的三维冠层结构,同时开展虚拟的LiDAR扫描监测生成LiDAR点云数据。也就是说,通过D3P虚拟表型实验的方法就可以获取大量算法开发所需要的数据集。
本研究以小麦为研究对象,研发基于地基LiDAR监测田间高通量FIPAR的方法,并同步估算影响光截获的GAI和AIA,用以综合比较不同基因型间冠层结构差异及其对冠层光截获能力的影响。利用D3P开展虚拟的表型实验,生成不同品种小麦的三维冠层并计算其FIPAR、GAI和AIA信息,进一步开展虚拟的LiDAR扫描监测,生成三维点云,并从中提取GF和高度分位数(H)两类特征。最后,选择人工神经网络(Artificial Neural Network,ANN)作为反演算法,实现从点云特征到目标特性的估算(图1)。
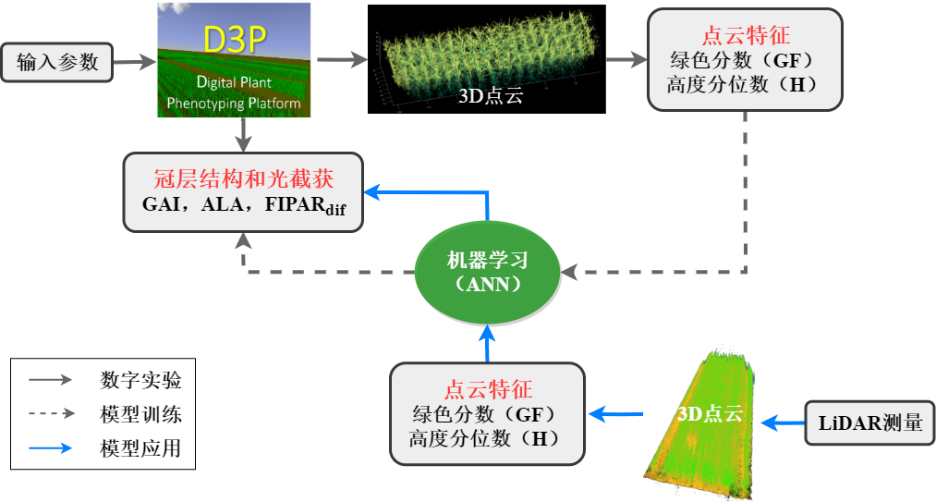
图 1 基于D3P和ANN的高通量冠层结构和光截获反演算法流程图
Fig. 1 Flow chart of the D3P and ANN based inversion algorithm for the high-throughput phenotyping of canopy structure and light interception
2 材料与方法
2.1 基于D3P的虚拟小麦LiDAR监测实验
数字化植物表型平台D3P主要包括结构功能模型(Functional Structural Plant Model,FSPM)和表型监测模拟两个部分(图2)。FSPM包含对作物从叶片到冠层尺度生理生态过程的模型描述,利用气象监测、栽培管理和作物参数等驱动,可以实现对作物三维生长动态的模拟[24,25]。D3P集成了OpenAlea植物三维模拟平台,其中包含多种作物的FSPM [26]。就小麦而言,研究主要使用的是ADEL-Wheat 模型[27]。此外,D3P的表型监测模拟部分实现了对RGB相机、多光谱相机和LiDAR 3种主要表型监测设备的模拟。RGB和LiDAR模拟(图3)的原理和相关参数设置请参考[16,23]。
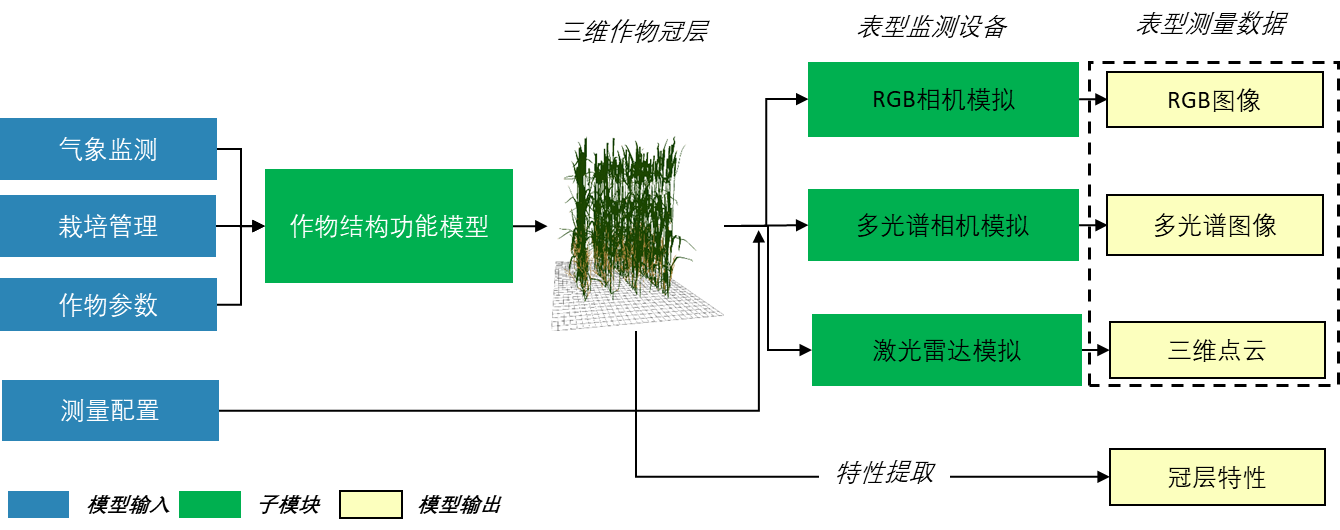
图 2 数字化植物表型平台, D3P(翻译和修改自文献[16])
Fig. 2 Digital Plant Phenotyping Platform, D3P (Revised from reference[16])
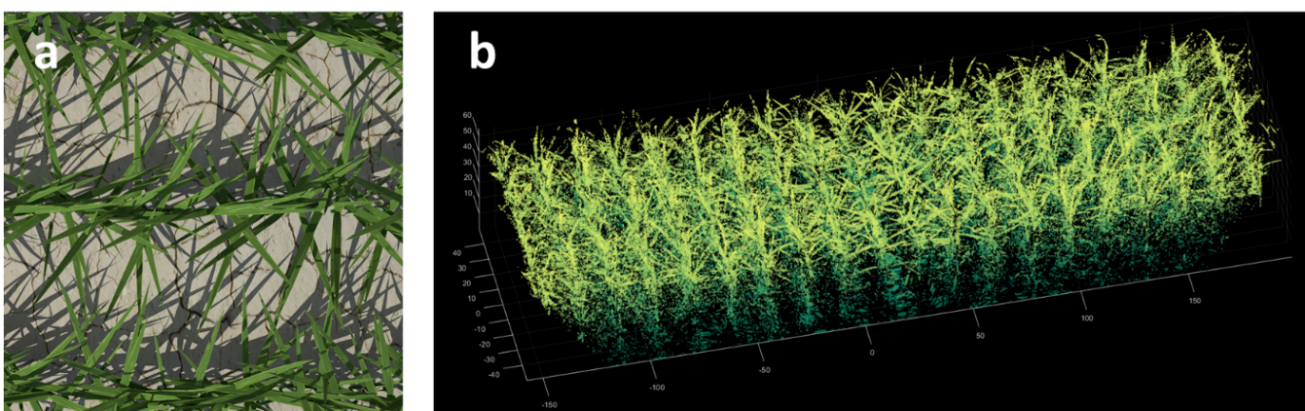
图 3 D3P模拟的RGB图像(a)和LiDAR三维点云(b)
Fig. 3 RGB imagery(a) and 3D LiDAR point cloud(b) generated byD3P
通过改变ADEL-Wheat模型中控制小麦冠层结构和生育期的12个主要参数(表1),可以实现对不同品种小麦三维冠层的模拟。本研究利用拉丁超立方采样方法,随机产生100组的模型参数,相当于考虑了100种不同基因型小麦的冠层结构差异。然后就每一组模型参数,生成200、400、600、800和1000 oC·d五个生育期的三维小麦场景。各场景的尺寸为100cm 长(沿行方向,X轴方向从-50到50cm)、400cm宽(垂直于行方向,Y轴方向从-200到200cm)和17.5cm的固定行距。土壤表面为平面,设置高度为0cm。植株沿Z轴正方向生长。参照田间高通量表型平台Phenomobile LiDAR的配置信息,设置相关参数如表2。每个三维场景进行虚拟LiDAR扫描的结果会产生一个三维点云数据,每个点包含其三维空间坐标和LiDAR入射的角度信息(D3P的代码已经上传到https://github.com/lsymuyu/Digital-Plant-Phenotyping-Platform;三维冠层和雷达点云原始数据可发邮件向通讯作者1索取)。
表 1 嵌入D3P的小麦ADEL-Wheat模型参数设置范围
Table 1 Parameter range of ADEL-Wheat
model interagted in D3P
| 最小值 | 最大值 | |
| 种植密度(株/m2) | 270 | 300 |
| 分蘖数 | 2.5 | 5 |
| 叶热间距( | 60 | 140 |
| 叶片旋转(°) | -40 | 40 |
| 主茎最终叶片数量 | 10 | 12 |
| 第一个叶片长度(cm) | 3 | 8 |
| 拔节期前叶片增长(cm) | 0 | 3.5 |
| 拔节期后叶片增长(cm) | 2.5 | 4.5 |
| 分蘖相对于主茎倾斜角度(°) | 10 | 85 |
| 衰老开始时,主茎绿色叶片数量 | 3.5 | 6.5 |
| 拔节期开始时,主茎绿色叶片数量 | 1.5 | 3.5 |
| 旗叶拔出叶鞘出现的时候,主茎绿色叶片数量 | 3.5 | 6.5 |
表 2 D3P中LiDAR参数及其搭载平台Phenomobile田间移动参数设置
Table 2 Settings of LiDAR sensor and the carrier platform Phenomobile in D3P
| 变量 | 数值 | 注释 | |
| Phenomobile | 速度(m/s) | 30 | 行驶速度 |
| 开始和结束 位置(cm) | -50-50 | 沿行方向(X轴)移动 | |
| 高度(cm) | 200 | 相对于地面高度 | |
| 方位角(°) | 0 | 扫描方向垂直于行方向 | |
| 天顶角(°) | 0 | 视角垂直向下(沿Z轴负方向) | |
| LiDAR | 角分辨率(°) | 0.2 | 每个角度一个扫描点 |
| 足迹宽度(mm) | 5 | 固定 | |
| 扫描频率(Hz) | 290 | ||
| 扫描范围(o) |
|
2.2 三维小麦场景FIPARdif、GAI和AIA的提取
为了计算各小麦三维场景的冠层光截获,本研究使用了基于辐射度原理改进的光传输模型Caribu [28],它较好地兼顾了运算效率和精度,可以满足模拟实验对大批量模拟的需求。绿色叶片吸收绝大部分入射的光合有效辐射(Photosynthetically Activate Radiation,PAR),因此,忽略叶片穿透率和反射率对FIPAR的影响[29],设置Caribu模型中小麦各器官的反射率、穿透率及土壤的反射率为零。在半球上均匀分割为46个角度,分别模拟各角度直射光截获,然后通过球面积分获得散射光的光截获FIPAR
dif,以其代表小麦冠层对各角度入射光的综合截获能力。此外,模拟的冠层场景被设置为无限,通过复制场景,消除边界效应对FIPAR模拟造成的误差。
小麦三维场景由三角形曲面组成。基于文献[30,31],绿色茎秆或叶鞘部分只考虑其面积的一半,真实的AIA和GAI的计算方法如下:
 (1)
(1)
 (2)
(2)
其中, 和
和 分别代表绿色叶片部分第i个三角形的倾角(法向量与Z轴的夹角,小于90°)和面积,单位分别为°和cm2;
 和
和 分别代表绿色茎秆或叶鞘部分第i个三角形的倾角和面积,单位分别为°和cm2;
 代表三维场景的面积,单位为cm2。
2.3 LiDAR三维点云特征提取
基于数字化表型监测结果,共计获得了100种小麦冠层结构类型、五个生育期的500个LiDAR三维点云。基于前期工作经验[16],对每个点云提取了两类特征。首先,提取点云在高度(Z值)剖面上的分布信息,即0.2、0.4、0.6和0.8四个分位数所对应的高度(缩写为H0.2、H0.4、H0.6和H0.8)。此外,提取多个角度的绿色分数GF信息。Z值低于0.5cm的点属于土壤点,Z值大于0.5cm的点属于冠层点。所有入射角度分为[0~10o,10~20o,20~30o]三组,用GF(5o)、GF(15o)和GF(25o)代表其相应的绿色分数。计算方法如下:
 (3)
(3)
其中, 和
和 分别代表在各个入射角度范围内的属于绿色冠层和土壤部分点的数量。
2.4 冠层结构反演方法
ANN是较为常用和高效的基于遥感监测的冠层结构指标反演方法[32,33],因此选择多层感知ANN进行从LiDAR特征到冠层结构(GAI和AIA)和光截获FIPARdif的反演(图1)。本研究选择单层前馈网络结构。第一层设置了5个神经元,使用tangent sigmoid作为激活函数。输出层有1个神经元,不使用激活函数。为了模拟实际监测过程中的误差,在LiDAR特征中分别加入5%、10%和20% 3种随机噪音,即认为噪音符合以0为均值,以数值的5%、10%和20%为标准差的高斯分布。此外,为了比较不同LiDAR提取特征的反演效果,本研究使用了只有H特征、只有GF特征和同时考虑H和GF特征3种输入分别建立反演模型。最后,就每个感兴趣的目标变量(GAI、AIA和FIPAR)都采取单一训练的方式,即每个目标变量都单独训练一个神经网络。整个数据样本中的85%用于模型的训练,15%用于模型的验证。模拟的预测精度用决定系数R2、均方根误差RMSE和相对均方根误差rRMSE进行评价。
3 结果与分析
3.1 小麦冠层结构和光截获的生育期动态
图4展示了小麦冠层结构的生育期动态,误差棒代表标准差,样本数为500。生育期大体分成两个阶段:从萌芽(积温0 )到拔节期(积温500 左右),GAI(图4(a))和各分位数所对应的高度(图4(c))缓慢增长,AIA较小且保持基本恒定(图4(b)),冠层结构平展;从拔节期到旗叶拔出叶鞘(积温1000 左右),GAI(图4(a))和各分位数所对应的冠层高度(图4(c))快速增加,AIA较大且不断增加(图4(b)),冠层结构不断紧凑。此结果由D3P模拟而来,其发现的结论与实测试验发现的小麦冠层结构的生育期动态规律一致[34]。
冠层散射光截获FIPARdif主要由GAI和AIA决定[35,36]。大体上,FIPARdif随着GAI的升高而升高,而随着AIA的升高而降低。从萌芽到拔节期,尽管GAI较低,但冠层平展,综合起来表现为FIPARdif的快速增加(图4(d))。然而,从拔节期到旗叶拔出叶鞘,GAI和AIA都快速增加,冠层逐渐紧凑,而FIPARdif逐渐趋近于1,对冠层结构变化敏感度降低。
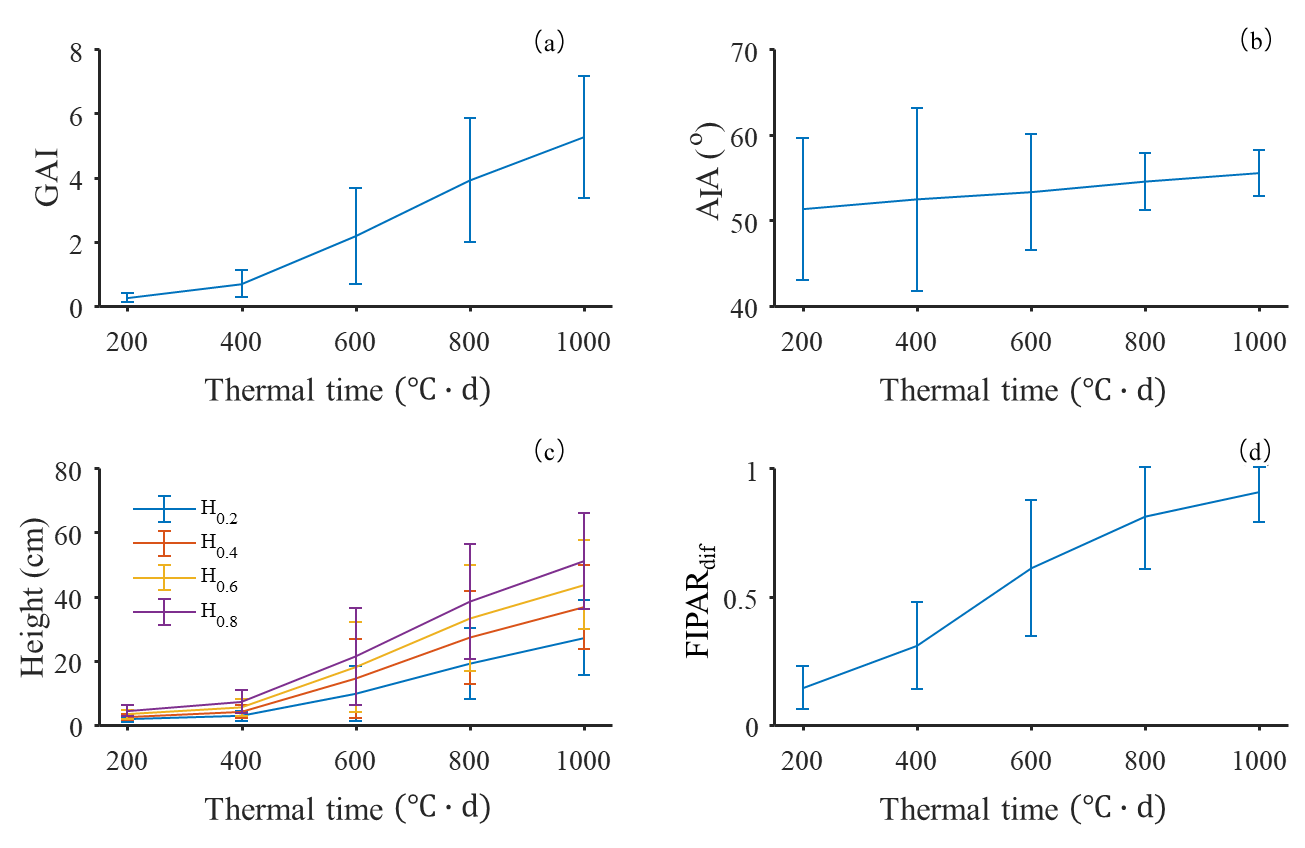
图 4 D3P模拟数据集提取的的小麦冠层结构(GAI, AIA, Height)和FIPARdif的生育期动态
Fig.4 Dynamic of wheat canopy structure (GAI, AIA, Height) and FIPARdif extracted from the D3P simulation
3.2 点云特征与各目标性状间关系
从LiDAR监测获取的三维点云中提取了高度分位数(H)和绿色分数(GF)两种信息。其中,4个冠层的H之间表现了非常高的线性相关性(图5),这主要是因为在垂直剖面上,各个位置之间叶片尺寸具有很高的相关性[23,37]。此外,各角度所对应的GF之间也具有很高的相关性,这主要是由于在角度较小的范围内,GF对于视角变化不敏感[38]。
冠层高度与GAI的生育期动态变化规律一致(图4),H特征与GAI表现较高的线性相关性,而GF特征与GAI呈现指数关系(图5)。AIA与GF特征相关性不显著。尽管AIA与H特征之间的相关性达到了极显著水平,但相关系数较低(小于0.22)。FIPAR
dif与H特征相关性最高,尤其是H0.6和H0.8,二者之间呈现很强的指数关系。
注:数字代表横轴和纵轴两个变量之间的相关关系。** 代表P <0.01,*代表 P < 0.05。
图 5 点云特征之间以及与冠层结构参数和光截获之间的相关关系
Fig.5 Correlations between LIDAR-derived features and canopy structural parameters or canopy light interception
3.3 冠层结构和光截获估算精度
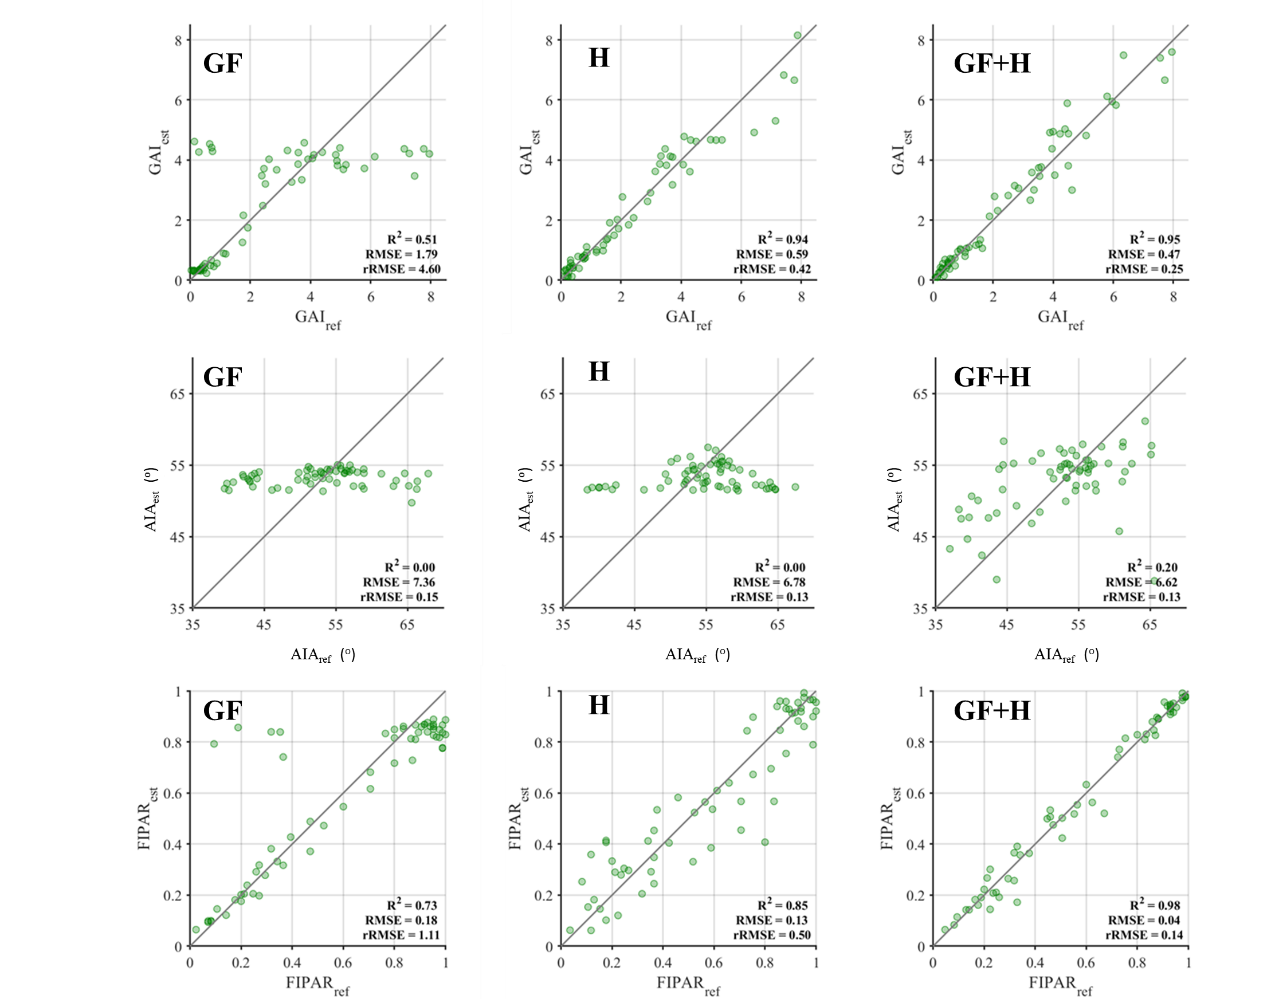
如图6和表3所示,模型输入的特征选择和点云特征提取精度对预测模型的表现有显著影响。就输入特征选择而言,对于GAI、AIA和FIPAR的估算,预测精度从高到低的输入为GF+H>H>GF(图6)。整体上,H特征与各目标性状之间的相关性高于GF特征(图5),仅使用H特征的效果优于GF特征。具体而言,从萌芽到拔节期,作物高度增长缓慢,相较于H特征,GF特征携带更多反应冠层结构变化的信息;从拔节期到旗叶拔出叶鞘,随着冠层的郁闭,GF对冠层结构(GAI和AIA)变化敏感度降低,而该阶段高度开始快速增加,H能够更好的反应冠层结构变化。因而,同时使用GF和H特征,可以获得更高的反演精度,在中等噪音强度(10%)情况下,GAI,AIA和FIPARdif的rRMSE分别为0.25,0.13和0.14。FIPARdif的估算精度优于GAI和AIA,主要是由于综合两个性状之后的补偿效应。也正因此,即使在噪音较大(20%)的情况下,FIPARdif的估算精度仍保持在可以接受的范围(rRMSE=0.27)(表3)。但是,即使在噪音很低(5%)的情况下,AIA的估算精度仍然较差,R2不高于0.44(表3)。
表 3 不同模型输入(GF,H,GF + H)和噪音程度(5%,10%,20%)情况下目标性状估算精度
Table 3 Estimation accrucy for traits targtted under different input features(GF,H,GF+H) and noise levels(5%,10%,20%)
| 性状 | 噪音 特征 | R2 | RMSE | rRMSE | |||||||
| 5% | 10% | 20% | 5% | 10% | 20% | 5% | 10% | 20% | |||
| GAI | GF | 0.55 | 0.51 | 0.42 | 1.7 | 1.79 | 1.94 | 4.26 | 4.6 | 4.53 | |
| H | 0.96 | 0.94 | 0.88 | 0.48 | 0.59 | 0.83 | 0.40 | 0.42 | 0.51 | ||
| GF+H | 0.97 | 0.95 | 0.83 | 0.34 | 0.47 | 0.89 | 0.17 | 0.25 | 0.43 | ||
| AIA | GF | 0 | 0 | 0 | 26.35 | 7.36 | 7.38 | 0.58 | 0.15 | 0.15 | |
| H | 0.13 | 0.00 | 0.00 | 6.17 | 6.78 | 6.78 | 0.12 | 0.13 | 0.13 | ||
| GF+H | 0.44 | 0.20 | 0.01 | 5.53 | 6.62 | 7.34 | 0.11 | 0.13 | 0.16 | ||
| FIPARdif | GF | 0.75 | 0.73 | 0.63 | 0.17 | 0.18 | 0.21 | 1.06 | 1.11 | 1.14 | |
| H | 0.98 | 0.97 | 0.96 | 0.05 | 0.05 | 0.06 | 0.22 | 0.24 | 0.29 | ||
| GF+H | 0.99 | 0.98 | 0.94 | 0.03 | 0.04 | 0.07 | 0.09 | 0.14 | 0.27 | ||
注:H代表高度分位数特征,GF代表绿色分数特征,GF+H代表同时考虑两种特征。
图 6 在中等测量噪音强度(10%)下目标性状(GAI、AIA和FIPAR)在不同特征
输入(GF、H和GF+H)情况下的估算精度
Fig.6 Estimation accuracy for traits targeted (i.e., GAI, AIA, and FIPAR) with different inputs
(i.e., GF, H, and GF+H) under moderate observation noise
4 讨论和结论
借助于D3P,通过开展数字化的小麦表型实验,本研究研发了一种基于地基LiDAR的田间小麦冠层光截获和冠层结构的高通量表型算法。FIPARdif和GAI的估算均获得了满意精度。尤其在田间条件下,FIPARdif能更直接反应不同品种间冠层尺度上光合能力的强弱,结合生物量信息,可进一步获取其辐射利用效率[39],为育种提供了非常重要的功能性状。此外,本研究更进一步验证了D3P在辅助表型算法开发的能力。
4.1 综合使用GF特征和H特征是准确估计冠层结构和光截获特性的关键
在小麦萌芽到拔节期,叶面积不断增加,而冠层高度增加缓慢,GF是反应这个时期冠层结构变化的主要特征。但由于在这个时期,冠层郁闭度较低,GF特征对冠层结构变化敏感[40],保证了目标特性的准确估算。在拔节期之后,冠层逐渐郁闭,GF特征对冠层结构变化敏感度逐渐降低,而冠层高度快速增加,H特征是这个时期目标特性准确估算的关键。可见,虽然GF特征和H特征在小麦不同生育期对于目标特性估算的重要性有所变化,但是综合使用两种特征是保证全生育期小麦冠层结构和光截获特性准确估计的关键。
本研究中仅使用GF特征的GAI反演精度较差,这与前人结果差异较大[40]。主要是因为:1)基于GF特征的GAI反演算法的局限之一在于GAI较大时候GF饱和。然而为了挑战算法的能力,本研究模型检验选择的GAI数值相对较大。在GAI较大值时的模型误差,拉低了模型的整体精度;2)GF与冠层结构关联性的强弱与GF对应的角度有关。由于本研究模拟实验采用的LiDAR型号自身特性的限制,GF的角度分别为0~10o、10~20o和20~30o,这并非估算GAI的最适角度(57.5o),这也是造成GAI估算精度较低的原因之一。这也意味着,通过优化LiDAR的角度,也许可以获得更高的GAI估算精度。
相较于地基RGB相机或多光谱相机监测,LiDAR的缺陷在于其空间分辨率较低,无法捕捉小麦冠层中许多细小的结构[41]。然而,在田间光环境比较复杂的情况下,利用RGB或多光谱影像中的光谱特征可能无法很好实现对绿色冠层和背景的分割,进而造成GF的估算精度较低。虽然LiDAR监测空间分辨率相对较低,但其并不受光环境影响,借助于三维点云的GF估算也许能达到与RGB或多光谱影像相当的精度。当然,这有待进一步验证。更重要的是,相对于GF,H特征对冠层结构和光截获估算精度影响更大,而从RGB或多光谱影像无法直接提取H特征,这凸显了LiDAR监测在小麦冠层结构和光截获能力估算的优势。
4.2 D3P提高表型算法开发效率
近年来,得益于相机、LiDAR等传感器、无人机和无人车等搭载平台以及计算机等计算存储单元的整体性能提升和价格降低,通过集成传感器、搭载平台和计算存储平台,科研单位和表型公司开发了多种适合于室内或者室外条件的高通量表型监测平台,实现了对作物生长的高通量监测[7]。然而,海量表型数据的挖掘成了真正发挥高通量表型平台效益的关键。本研究和Liu[16]展示了基于D3P的LiDAR表型监测算法开发,Liu[23]给出了基于D3P的RGB图像动态监测的数据同化方法,一系列工作表明,D3P提供了一个可靠的虚拟表型实验模拟平台,能够极大提高表型算法的开发效率。
本研究采用ANN作为从LiDAR特征到目标特性的反演模型。ANN具有很强的拟合非线性关系的能力,但缺点是需要大量的训练样本。得益于D3P提供的虚拟表型实验环境,本研究开展了100个品种5个生育期的虚拟小麦LiDAR监测实验,生成了三维点云数据,并输出了对应的真实的光截获和冠层结构性状。这些数据被用来训练和验证ANN模型。显然,相较于通过田间实测来收集训练样本,D3P的使用极大的提高了表型算法开发的效率。此外,通过增加随机噪音,D3P的模拟结果更接近于真实监测,ANN模型过拟合的可能性降低,泛化适用性进一步增强。当然,由于小麦三维结构和LiDAR模拟的可能偏差,模型的实际表现仍有待田间实测数据的进一步检验。尽管如此,前期工作利用D3P开发了基于LiDAR监测的GAI估算方法[16],田间实测数据检验取得了满意结果,已经证明了D3P在LiDAR模拟和开发相关算法方面的能力。
4.3 利用深度机器学习方法优化点云特征提取和反演算法值得进一步探索
AIA是除了GAI之外冠层结构的重要指标,也是判断作物理想株型的关键性状[42],然而这里AIA的估算并没有取得很好的结果。如上文分析,模型输入特征的选择对估算精度具有重要影响。本研究中提取的H和GF两种特征,主要还是基于人工经验,无法充分代表三维点云所携带的信息。在基于RGB图像的表型信息提取中,深度学习算法已经被广泛使用[43,46]。得益于深度学习方法多维数据的概括能力,图像识别、分割精度和模型适用性得到极大提高[47,48]。利用深度学习方法在处理LiDAR表型数据方面,Jin等[18,49]进行了有益的尝试。然而对无序点云的多尺度特征提取,建立以数据为驱动的最优化反演模型[50]仍有待进一步探索。
参考文献
[1] Godfray H C, Beddington J R, Crute I R, et al. Food security: The challenge of feeding 9 billion people[J]. Science, 2010, 327(5967): 812-818.
[2] Liu B, Asseng S, Müller C, et al. Similar estimates of temperature impacts on global wheat yield by three independent methods[J]. Nature Climate Change, 2016, 6(12): 1130-1136.
[3] Araus J L, Cairns J E. Field high-throughput phenotyping: the new crop breeding frontier[J]. Trends in Plant Science, 2014, 19(1): 52-61.
[4] Furbank R T, Tester M. Phenomics-technologies to relieve the phenotyping bottleneck[J]. Trends in Plant Science, 2011, 16(12): 635-644.
[5] Chapman S C, Zheng B, Potgieter A, et al. Visible, infrarednear, and thermal spectral radiance on-board UAVs for high-throughput phenotyping of plant breeding trials[M]. Thenkabail P S, Lyon J G, Huete A. Biophysical and biochemical characterization and plant species studies. CRC Press, 2018: 275-298.
[6] Martre P, Quilot-Turion B, Luquet B, et al. Model-assisted phenotyping and ideotype design[M]. Victor O S, Calderini D F. Crop Physiology. Academic Press, 2015: 349-373.
[7] Tardieu F, Cabrera-Bosquet L, Pridmore T, et al. Plant phenomics, from sensors to knowledge[J]. Current Biology, 2017, 27(15): 770-783.
[8] Monteith J L. Climate and the efficiency of crop production in Britain[J]. Philosophical Transactions of the Royal Society of London Series B: Biological Sciences, 1977, 281(980): 277-294.
[9] Monteith J L. Validity of the correlation between intercepted radiation and biomass[J]. Agricultural and Forest Meteorology, 1994, 68(3-4): 213-220.
[10] Parry M A, Reynolds M, Salvucci M E, et al. Raising yield potential of wheat II. increasing photosynthetic capacity and efficiency[J]. Journal of Experimental Botany, 2010, 62(2): 453-467.
[11] Furbank R T, Jimenez-Berni J A, George-Jaeggli B, et al. Field crop phenomics: Enabling breeding for radiation use efficiency and biomass in cereal crops[J]. New Phytologist, 2019, 223(4): 1714-1727.
[12] Su Y, Wu F, Zurui A, et al. Evaluating maize phenotype dynamics under drought stress using terrestrial lidar[J]. Plant Methods, 2019, 15(1): 11-26.
[13] Cabrera-Bosquet L, Fournier C, Brichet N, et al. High throughput estimation of incident light, light interception and radiation use efficiency of thousands of plants in a phenotyping platform[J]. New Phytologist, 2016, 212(1): 269-281.
[14] Weiss M, Baret F. fAPAR (fraction of Absorbed Photosynthetically Active Radiation) estimates at various scale[C]// 34th International Symposium on Remote Sensing of Environment, 2011.
[15] Baret F, Madec S, Irfan K, et al. Leaf-rolling in maize crops: From leaf scoring to canopy-level measurements for phenotyping[J]. Journal of Experimental Botany, 2018, 69(10): 2705-2716.
[16] Liu S, Baret F, Abichou M, et al. Estimating wheat green area index from ground-based LiDAR measurement using a 3D canopy structure model[J]. Agricultural and Forest Meteorology, 2017, 247: 12-20.
[17] Jimenez-Berni J A, Deery D M, PabloRozas-Larraondo, et al. High throughput determination of plant height, ground cover, and above-ground biomass in wheat with LiDAR[J]. Frontiers in Plant Science, 2018, 9: no. 237.
[18] Jin S, Su Y, Gao S, et al. Deep learning: Inpidual maize segmentation from terrestrial lidar data using faster R-CNN and regional growth algorithms[J]. Frontiers in Plant Science, 2018, 9: no. 866.
[19] Jin S, Su Y, Wu F, et al. Stem-leaf segmentation and phenotypic trait extraction of inpidual maize using terrestrial LiDAR data[J]. IEEE Transactions on Geoscience and Remote Sensing, 2018, 57(3): 1336-1346.
[20] Lin Y. LiDAR: An important tool for next-generation phenotyping technology of high potential for plant phenomics?[J]. Computers and Electronics in Agriculture, 2015, 119: 61-73.
[21] Campbell G S, Norman J M. An Introduction to Environmental Biophysics[M]. New York: Springer, 1998.
[22] Zhao K, García M, Liu S, et al. Terrestrial lidar remote sensing of forests: Maximum likelihood estimates of canopy profile, leaf area index, and leaf angle distribution[J]. Agricultural and Forest Meteorology, 2015, 209-210: 100-113.
[23] Liu S, Martre P, Buis S, et al. Estimation of plant and canopy architectural traits using the D3P Digital Plant Phenotyping Platform[J]. Plant Physiology, 2019, 181(3): 881-890.
[24] Godin C, Sinoquet H. Functional-structural plant modelling[J]. New phytologist, 2005, 166(3): 705-708.
[25] Vos J, Evers B, Buck-Sorlin H, et al. Functional-structural plant modelling: A new versatile tool in crop science[J]. Journal of Experimental Botany, 2010, 61(8): 2101-2115.
[26] Pradal C, Dufour-Kowalski S, Boudon F, et al. OpenAlea: A visual programming and component-based software platform for plant modelling[J]. Functional Plant Biology, 2008, 35(10): 751-760.
[27] Fournier C, Andrieu B, Ljutovac S, et al. ADEL-Wheat: A 3D architectural model of wheat development[C]// International Symposium on Plant Growth Modeling, Simulation, Visualization and their Applications (PMA03). 2003: 54-63.
[28] Chelle M, Andrieu B. The nested radiosity model for the distribution of light within plant canopies[J]. Ecological Modelling, 1998, 111(1): 75-91.
[29] Andrieu B, Baret F. Indirect methods of estimating crop structure from optical measurements, crop structure and light microclimate[M]. Crop Structure and Light Microclimate: Characterization and Application. Paris: INRA, 1993: 285-322.
[30] Chen J M, Black T Defining leaf area index for non-flat leaves[J]. Plant, Cell & Environment, 1992, 15(4): 421-429.
[31] Lang A R G. Application of some of Cauchy's theorems to estimation of surface areas of leaves, needles and branches of plants, and light transmittance[J]. Agricultural and Forest Meteorology, 1991, 55(3): 191-212.
[32] Baret F, Buis S. Estimating canopy characteristics from remote sensing observations: Review of methods and associated problems[M]. Liang S. Advances in Land Remote Sensing. Dordrecht: Springer, 2008: 173-201.
[33] Zhao K, Popescu S, Meng X, et al. Characterizing forest canopy structure with lidar composite metrics and machine learning[J]. Remote Sensing of Environment, 2011, 115(8): 1978-1996.
[34] Abichou M, de Solan B, Andrieu B. Architectural Response of wheat cultivars to row spacing reveals altered perception of plant density[J]. Frontiers in Plant Science, 2019, 10: 999.
[35] Baret F, Hagolle O, Geiger B, et al. LAI, fAPAR and fCover CYCLOPES global products derived from VEGETATION: Part 1: Principles of the algorithm[J]. Remote Sensing of Environment, 2007, 110(3): 275-286.
[36] Bacour C, Baret F, Béal D, et al. Neural network estimation of LAI, fAPAR, fCover and LAI×Cab, from top of canopy MERIS reflectance data: Principles and validation[J]. Remote Sensing of Environment, 2006, 105(4): 313-325.
[37] Martre P, Dambreville A. A model of leaf coordination to scale-up leaf expansion from the organ to the canopy[J]. Plant Physiology, 2018, 176(1): 704-716.
[38] Liu S, Baret F, Andrieu B, et al. Modeling the spatial distribution of plants on the row for wheat crops: Consequences on the green fraction at the canopy level[J]. Computers and Electronics in Agriculture, 2017, 136: 147-156.
[39] Sinclair R, Hone T. Leaf nitrogen, photosynthesis, and crop radiation use efficiency: A review[J]. Crop Science, 1989, 29: 90-98.
[40] Baret F, de Solan B, Lopez-Lozano R, et al. GAI estimates of row crops from downward looking digital photos taken perpendicular to rows at 57.5° zenith angle: Theoretical considerations based on 3D architecture models and application to wheat crops[J]. Agricultural and Forest Meteorology, 2010, 150(11): 1393-1401.
[41] Hartmann A, Czauderna T, Hoffmann R, et al. HTPheno: An image analysis pipeline for high-throughput plant phenotyping[J]. BMC bioinformatics, 2011, 12(1): 148.
[42] Donald C M. The breeding of crop ideotypes[J]. Euphytica, 1967, 17(3): 385-403.
[43] Jin X, Madec S, Dutartre D, et al. High-throughput measurements of stem characteristics to estimate ear density and above-ground biomass[J]. Plant Phenomics, 2019: no. 4820305.
[44] Madec S, Jin X, Lu H, et al. Ear density estimation from high resolution RGB imagery using deep learning technique[J]. Agricultural and Forest Meteorology, 2019, 264: 225-234.
[45] Pound M P, Atkinson J A, Townsend A J, et al. Deep machine learning provides state-of-the-art performance in image-based plant phenotyping[J]. Gigascience, 2017, 6(10): 1-10.
[46] Taghavi Namin S, Esmaeilzadeh M, Najafi M, et al. Deep phenotyping: Deep learning for temporal phenotype/genotype classification[J]. Plant Methods, 2018, 14(1): no. 66.
[47] Goodfellow I J, Pouget-Abadie J, Mirza M, et al. Generative adversarial nets[C]// International Conference on Neural Information Processing Systems, 2014: 2672-2680.
[48] Qi C, Yi L, Su H, et al. PointNet++: Deep hierarchical feature learning on point sets in a metric space[M]. Bach F R, Jordan M. Advances in neural information processing systems, 2017: 5099-5108.
[49] Jin S, Su Y, Gao S, et al. Separating the structural components of maize for field phenotyping using terrestrial lidar data and deep convolutional neural networks[J]. IEEE Transactions on Geoscience and Remote Sensing, 2020, 58(4): 2644-2658.
[50] Han J, Jentzen A, Weinan E. Solving high-dimensional partial differential equations using deep learning[J]. Proceedings of the National Academy of Sciences, 2018, 115(34): 8505-8510.
An algorithm for estimating field wheat canopy light interception based on Digital Plant Phenotyping Platform
Shouyang Liu1,2,3*, Shichao Jin5,6, Qinghua Guo5,6, Yan Zhu4, Fred Baret1,2,3*
(1.Plant Phenomics Research Centre, Nanjing Agricultural University, Nanjing 210095, China;
2.INRAE, EMMAH-CAPTE, Avignon 84914, France;3.Jiangsu Collaborative Innovation Centre for Modern Crop Production, Nanjing Agricultural University, Nanjing 210095, China;
4.Nanjing Engineering and Technology Centre for Information Agriculture, Nanjing Agricultural University/Engineering Research Centre for Smart Agriculture, Ministry of Education, Nanjing 210095
, China;
5.State Key Laboratory of Vegetation and Environmental Change, Institute of Botany, Chinese Academy of Sciences, Beijing 100093,China;6.University of Chinese Academy of Sciences, Beijing 100049, China)
Abstract: The capacity of canopy light interception is a key functional trait to distinguish the phenotypic variation over genotypes. High-throughput phenotyping canopy light interception in the field, therefore, would be of high interests for breeders to increase the efficiency of crop improvement. In this research, the Digital Plant Phenotyping Platform(D3P) was used to conduct in-silico phenotyping experiment with LiDAR scans over a wheat field. In this experiment virtual 3D wheat canopies were generated over 100 wheat genotypes for 5 growth stages, representing wide range of canopy structural variation. Accordingly, the actual value of traits targeted were calculated including GAI (green area index), AIA (average inclination angle) and FIPARdif (the fraction of intercepted diffuse photosynthetically activate radiation). Then, virtual LiDAR scanning were accomplished over all the treatments and exported as 3D point cloud. Two types of features were extracted from point cloud, including height quantiles (H) and green fractions (GF). Finally, an artificial neural network was trained to predict the traits targeted from different combinations of LiDAR features. Results show that the prediction accuracy varies with the selection of input features, following the rank as GF + H > H > GF. Regarding the three traits, we achieved satisfactory accuracy for FIPARdif (R2=0.95) and GAI (R2=0.98) but not for AIA (R2=0.20). This highlights the importance of H feature with respect to the prediction accuracy. The results achieved here are based on in-silico experiments, further evaluation with field measurement would be necessary. Nontheless, as proof of concept, this work further demonstrates that D3P could greatly facilitate the algorithm development. Morever, it highlights the potential of LiDAR measurement in the high-throuhgput phenopyting of canopy light interpcetion and structural traits in the field.
Key words: canopy light interception; high-throughput phenotyoing; LiDAR; Digital Plant Phenotyping Platform (D3P); wheat canopy
收稿日期:2020-02-12 修订日期:2020-03-01
基金项目:南京农业大学高层次引进人才经费(440-804005)
* 通讯作者:1.刘守阳(1987-),男,博士后,研究方向:作物表型,电话:+33 686447941,Email:shouyang.liu@inrae.fr;2.Fred Baret(1956-),男,研究员,研究方向:农业物遥感和表型,电话:+33 432722363,Email:frederic.baret@inrae.fr。
doi: 10.12133/j.smartag.2020.2.1.202002-SA004


客服QQ:30444492琼网文【2021】1550-113号
增值电信业务经营许可证:琼B2-20210322
出版物经营许可证:新出发龙华出字第(2021)009号
广播电视节目制作经营许可证:(琼)字第00779号
版权所有 ©2002-2024 期刊网(www.qikanchina.com) 琼ICP备2021005105号


 35
35